Getting started guide
Before we start
This tutorial is aimed at new users who want to see a practical example of risk modelling in the RiskScape Platform. We expect that you:
Have read the Overview and have a basic idea of what RiskScape is about.
Have a Platform user account and have access to the Getting Started Platform project
This tutorial uses a real world scenario to walk you through the basics of using the RiskScape Platform for risk modelling. Important concepts will be explained as we go.
➡ Actions you need to do yourself will begin with an arrow, like this paragraph.
🌐 Steps that involve viewing geospatial data begin with a globe, like this paragraph. The RiskScape Platform provides a simple viewer for some geospatial data formats. If you are familiar with GIS data and have a GIS software application installed on your computer (e.g. QGIS, ArcGIS), you can always download the data and open it in your preferred viewer.
Note
The RiskScape Platform’s geospatial viewer is currently a beta feature. If data appears to be missing, try reloading the page. If needed, you can always revert to downloading the file and opening it in your preferred viewer.
Tip
If you are an ArcGIS user and you experience any trouble downloading and opening the RiskScape model results, then refer to RiskScape Engine documentation for some trouble-shooting tips on how to best open the model outputs in ArcGIS.
Example model overview
This tutorial uses example RiskScape models that determine tsunami exposure in Samoa, based on the 2009 South Pacific Tsunami (SPT) event.
A RiskScape model typically combines together various geospatial layers, and then performs some form of risk analysis. For this model, we have a building dataset for the island of Upolu and we want to find out which buildings will be affected by a tsunami hazard, and what the likely damage will be. This involves combining the following layers:
A building dataset for south-eastern Upolu, based on Open Street Map data. This is called the exposure-layer in RiskScape.
A tsunami inundation map, based on the 2009 SPT. If you want to, you can read more about how this hazard-layer was produced here.
Regional boundaries for Samoa. This is called the area-layer, and can be optionally used to collate the model results, e.g. reporting the number of exposed buildings in each region.
You can click on the above links to show the files from the RiskScape Platform, and familiarize yourself with the input data. A zoomed-out view of the input data will look like the following:
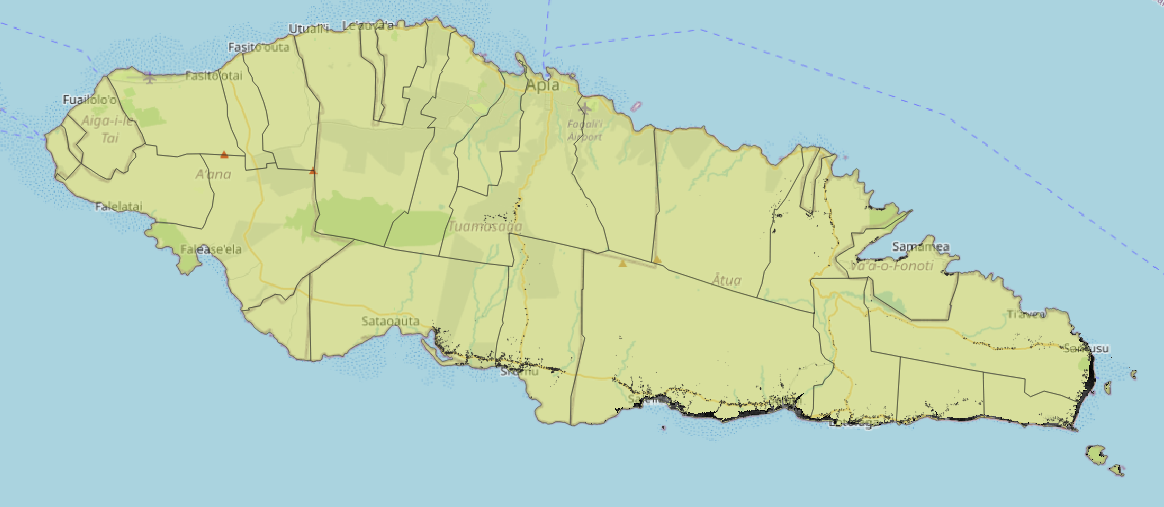
This is a screenshot of the geospatial data overlaid on an OpenStreetMap background. Barely visible on the south-east coast are building outlines and the tsunami hazard.
Zooming in a little closer, the building outlines and inundation hazard grid will look something like the following:
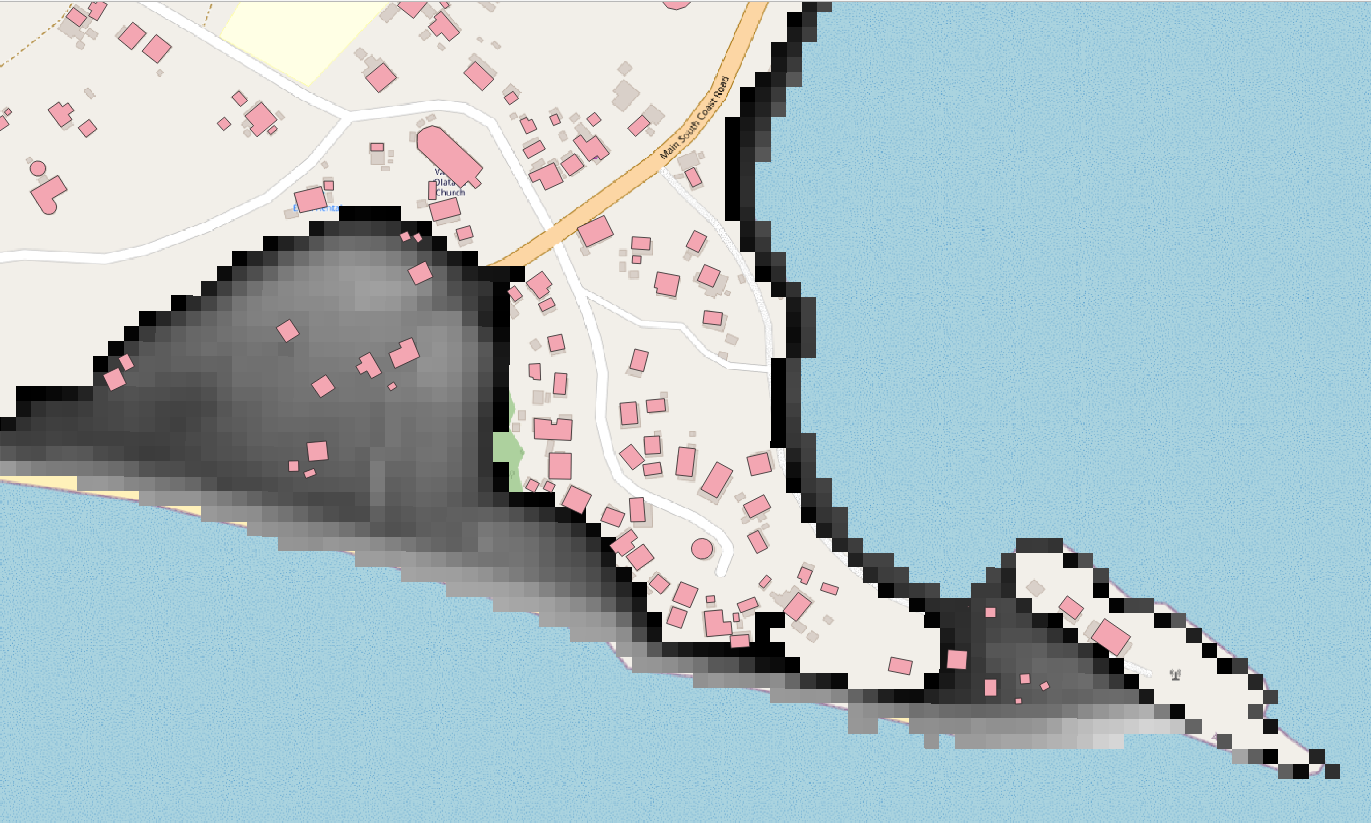
Here the building outlines (polygons) are in pink, overlaid against the tsunami inundation grid, which are greyscale squares.
RiskScape Projects
RiskScape projects are used to organize your models. Each project in the RiskScape Platform has:
One or more risk models. A model requires a RiskScape Engine to run it in order to produce results.
A set of users who can access the model and run it. Each user has a role in the project, which determines what the user can and cannot do.
Project files, which includes the input data for the models, as well as all the instructions that the RiskScape Engine needs to perform the analysis.
Results from previous model runs. You can optionally save results or share them with the other users in the project.
When you login to the RiskScape Platform, by default you will be given a list of all the projects you have been added to. It will look something like this:
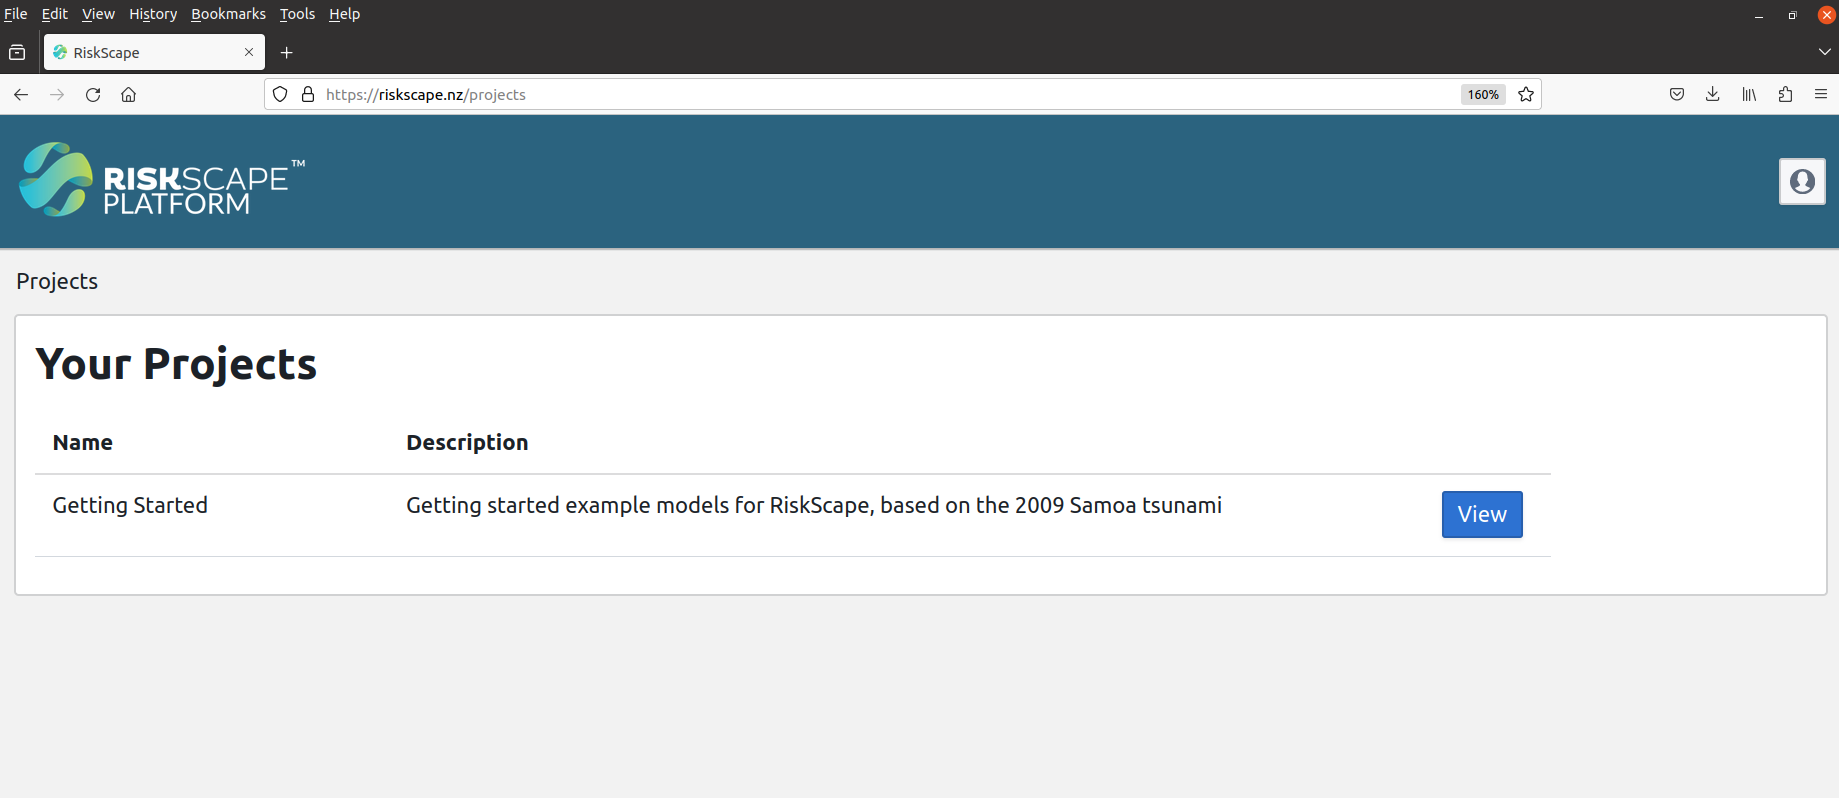
➡ Make sure you are logged into the RiskScape Platform and click the ‘View’ button for the Getting Started project. Alternatively, you can click this link to go directly there.
RiskScape models
When you browse to a project in the Platform, you will get a list of the models in that project. For the Getting Started project, the list of models should look like this:
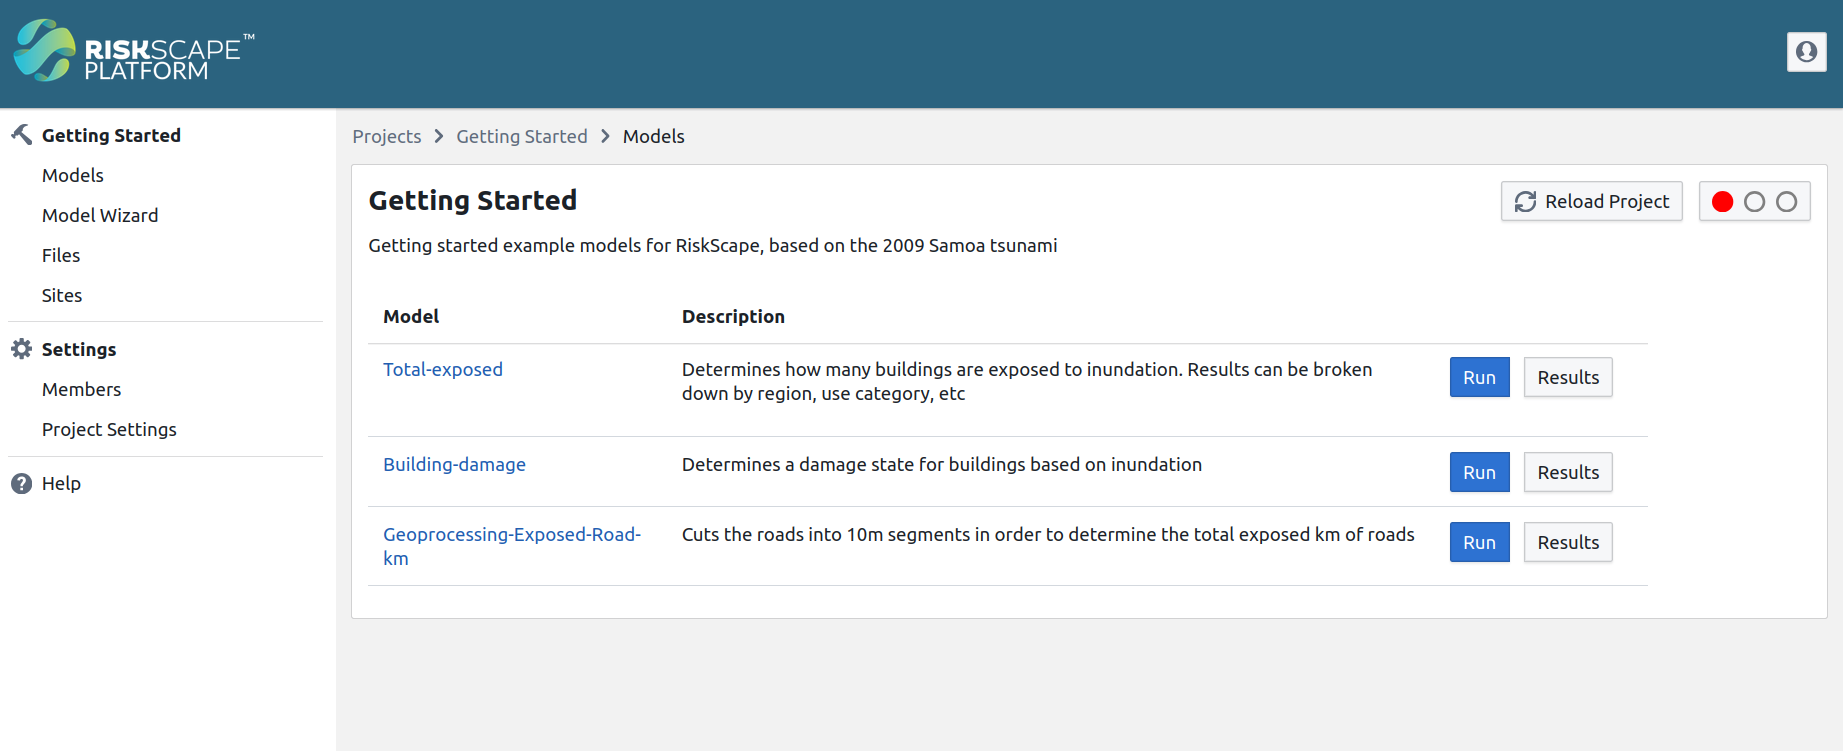
The ‘Run’ button will let you view the model parameters and potentially run the model. The ‘Results’ button will show you previous results from running the model, including any results that other users have shared with you.
➡ Click on the ‘Run’ button for the ‘Total-Exposed’ model. Alternatively, you can click this link to go directly there.
Starting the RiskScape Engine
The Total-Exposed model page will initially look like this:
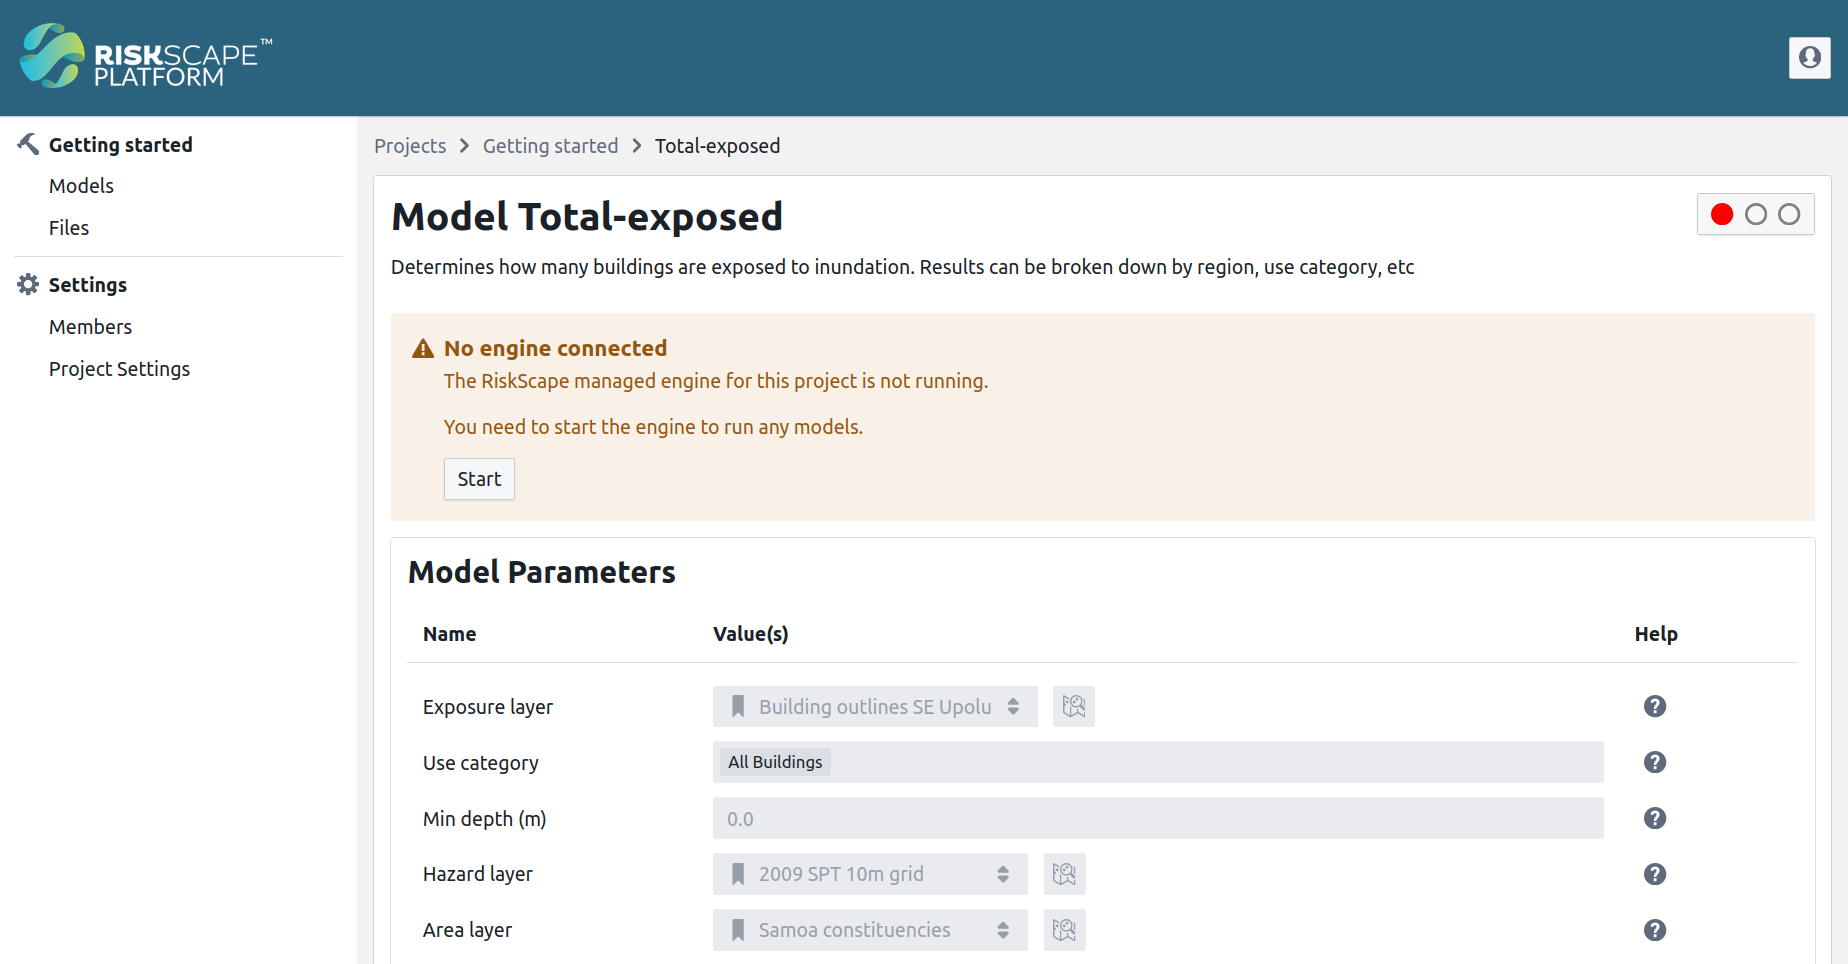
Models require a RiskScape Engine resource in order to run. The RiskScape Engine is like a highly specialized risk calculator that crunches all your data and outputs results.
Note
The RiskScape Engine typically runs in the cloud, which will incur some costs while the Engine is running. You will get your own dedicated cloud Engine for running models. Therefore, the Engine only runs when it needs to.
➡ Click on the ‘Start’ button to start the Engine. It may take a while for the Engine to be created and finish starting up. While the Engine is starting up, it should look like this:
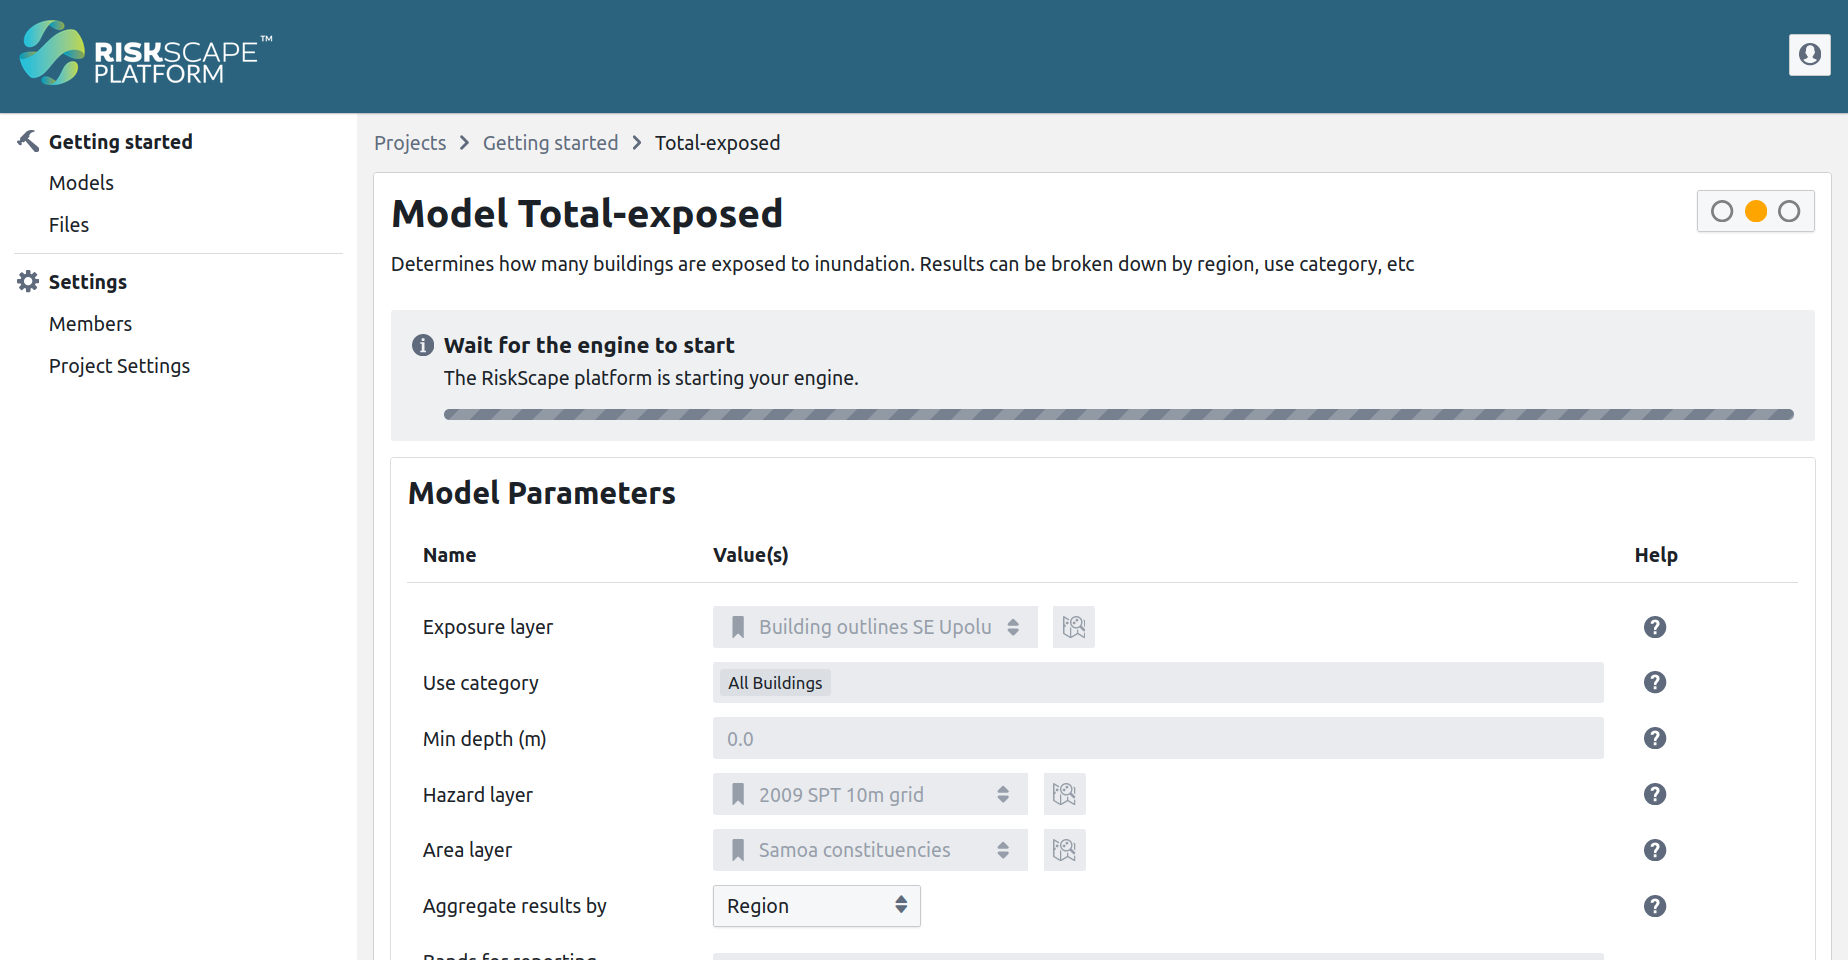
Running a model
Once the Engine finishes starting up, the Total-Exposed model page should look like this:
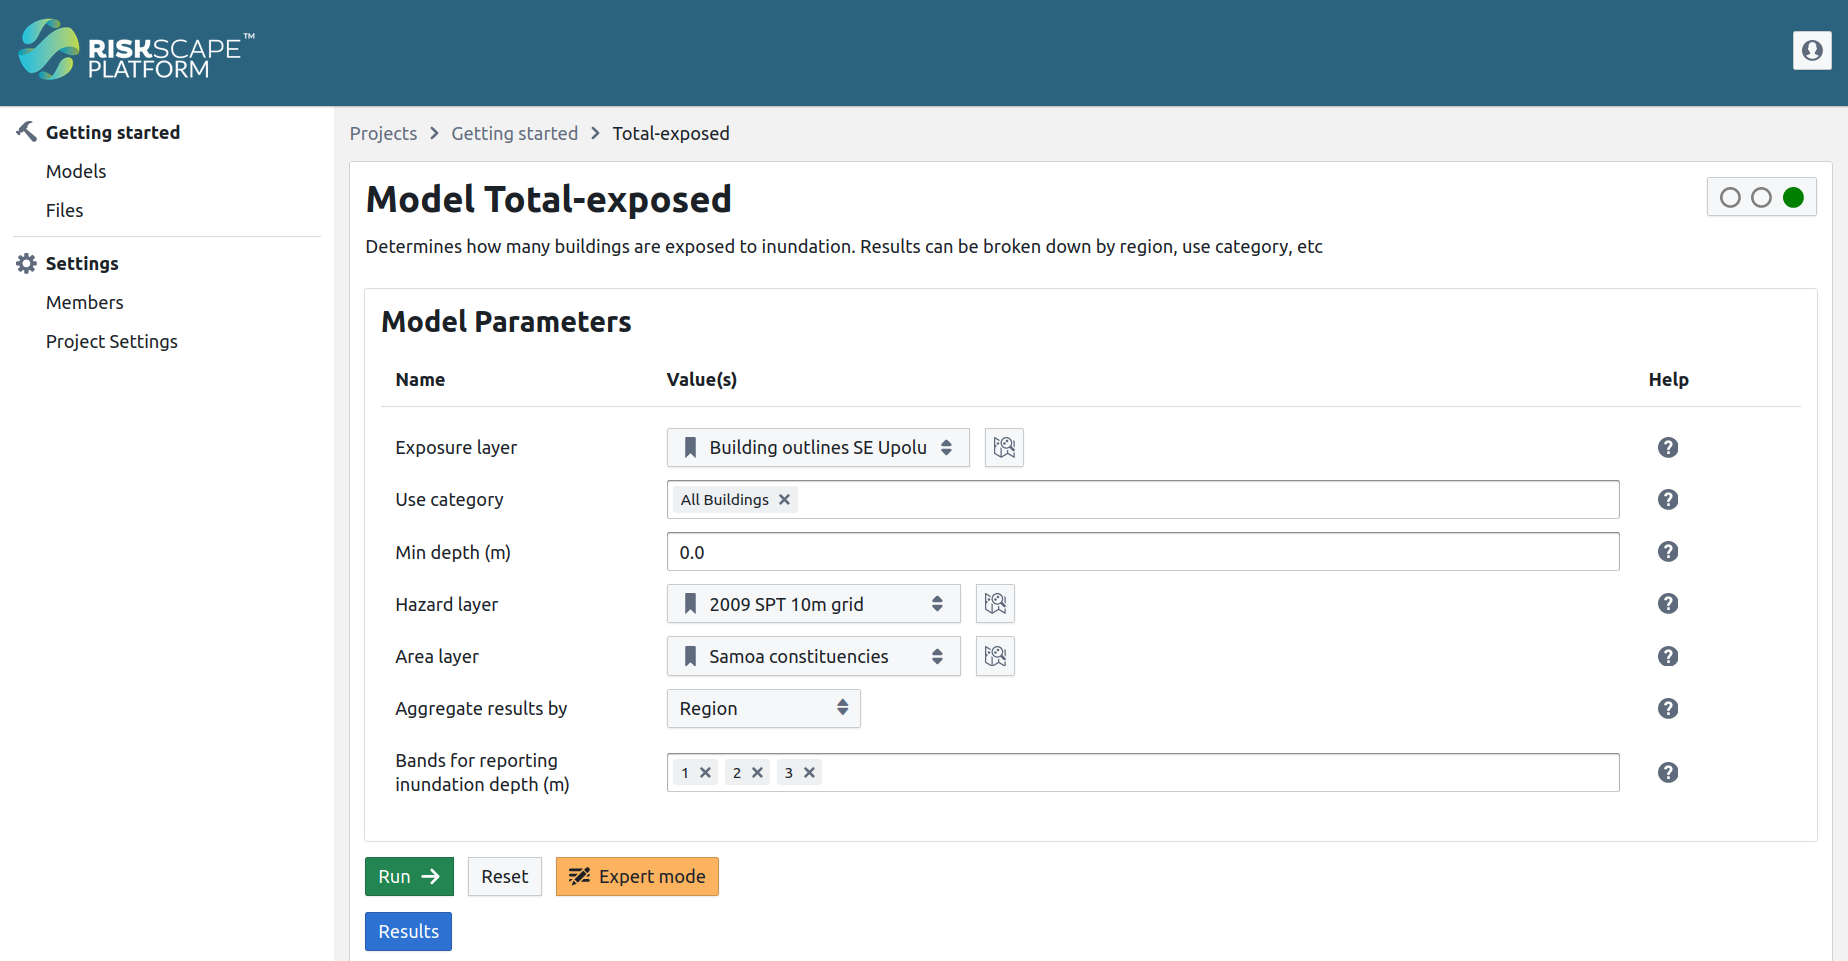
The Total-Exposed model determines the total number of buildings exposed to tsunami inundation. The model page shows you a form with the model’s parameters, which lets you customize the risk analysis when you run a model.
➡ Click the ‘Run’ button to run the model.
The model should take a few seconds to run. While the model is busy running, a progress bar will be displayed at the bottom of the page that looks like this:
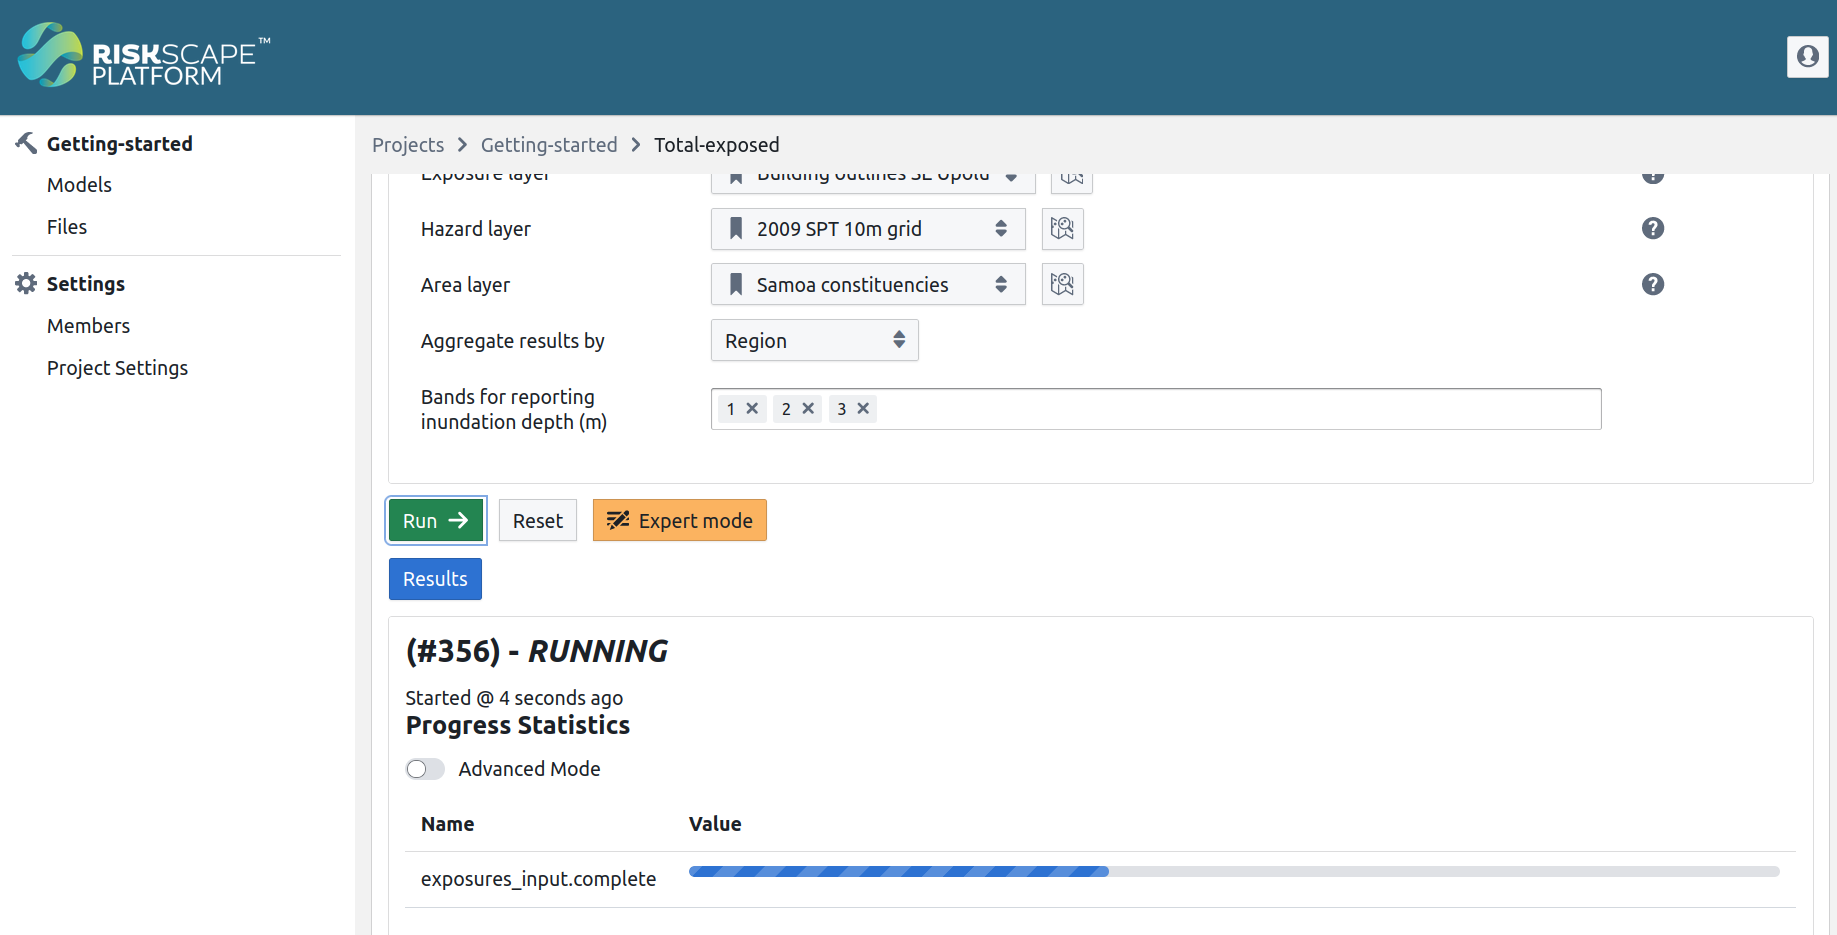
Once the model finished running, the model results will be displayed, which look like this:
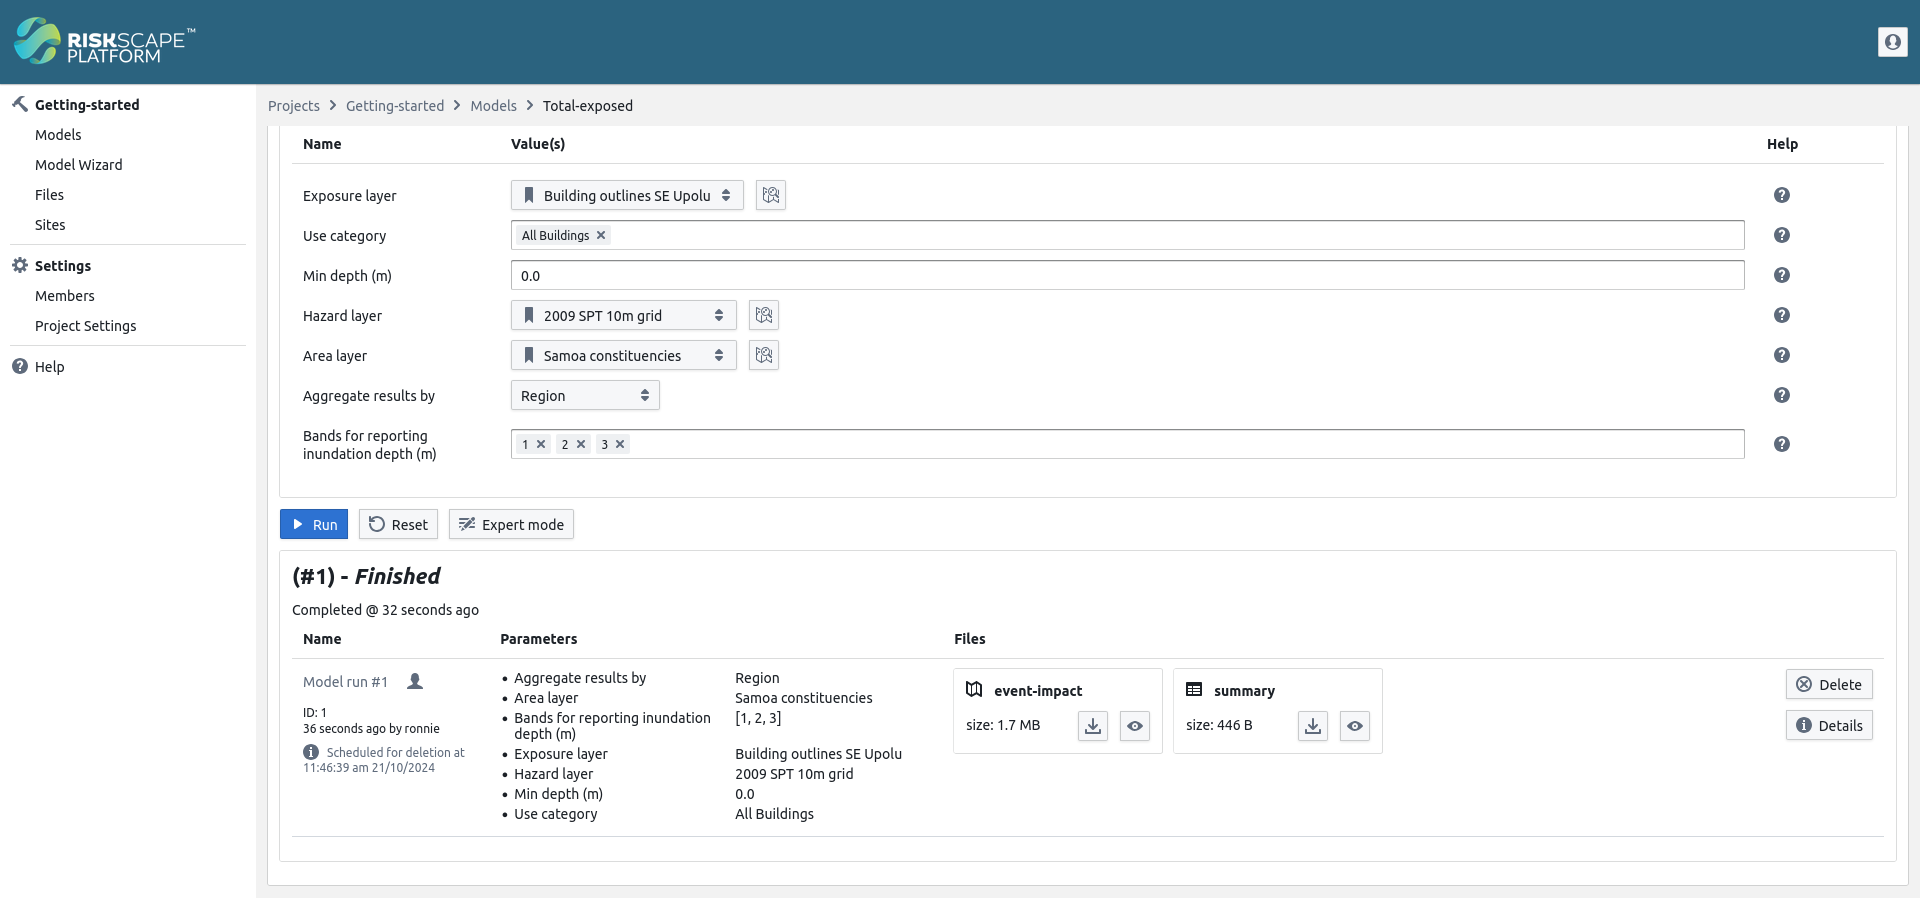
➡ Click the eye icon for the ‘summary’ result to open the CSV viewer. Your model results should look like this:
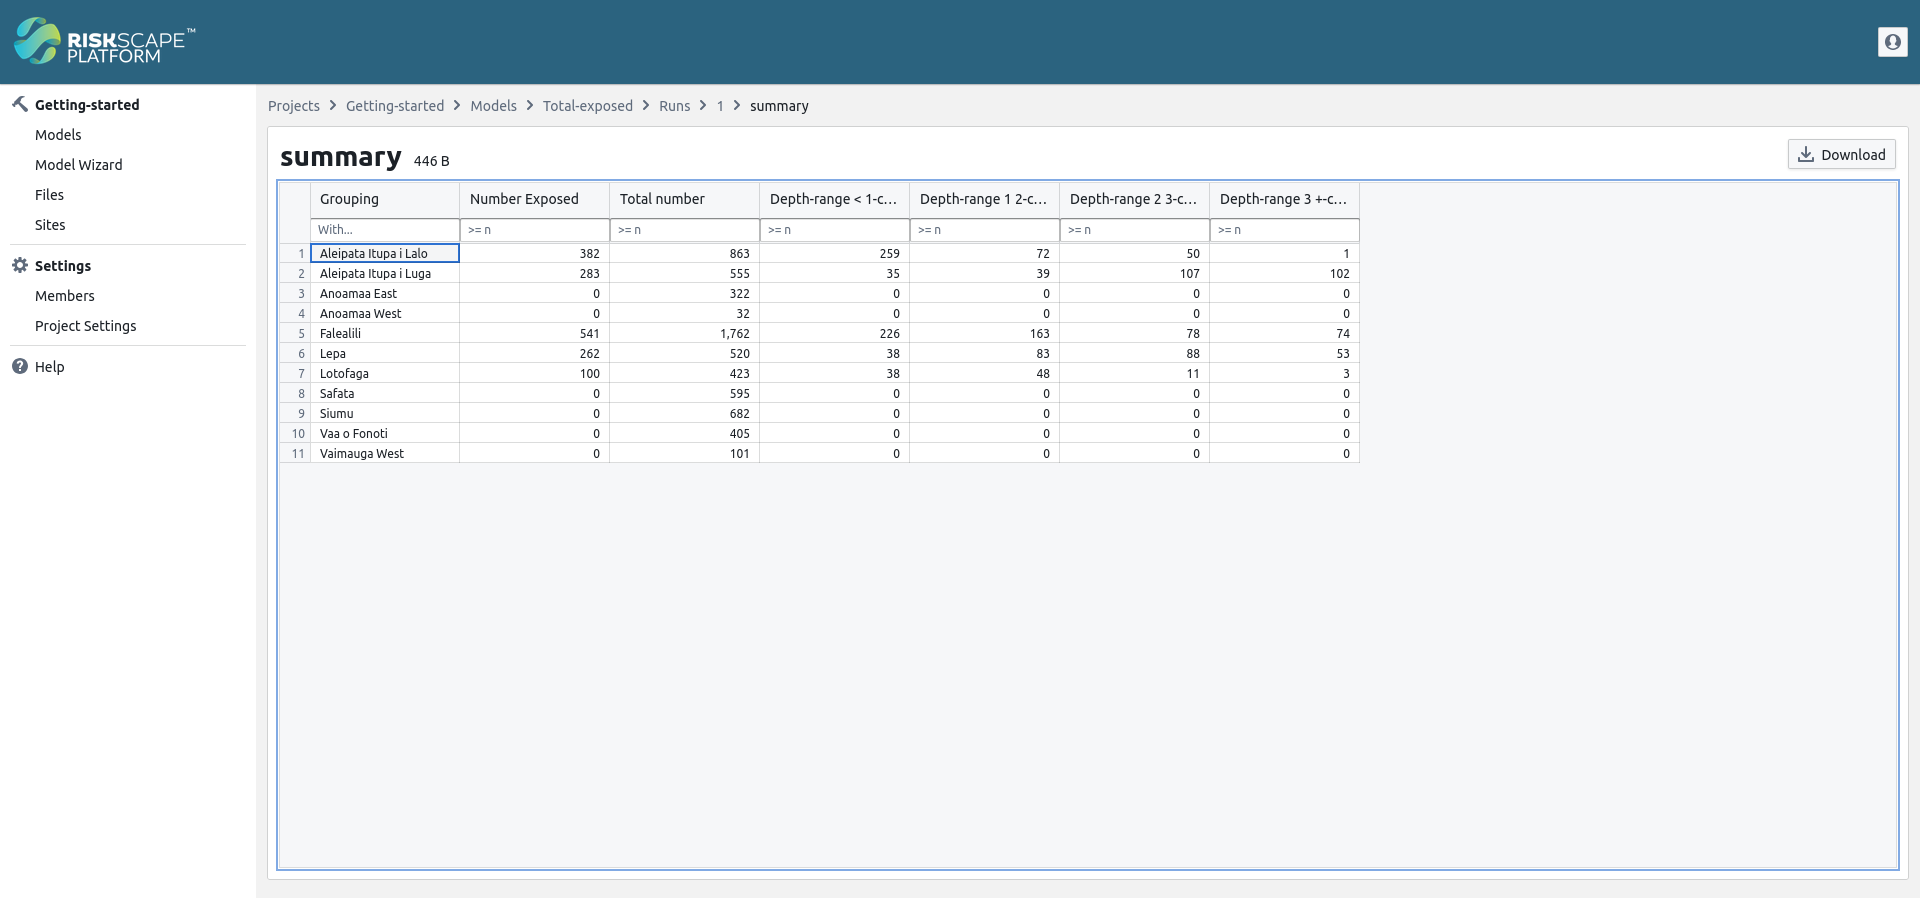
This results file summarizes the effects of the tsunami, reporting the total number of buildings that were exposed
in each affected region of Samoa.
The Depth.range column shows how many buildings were exposed to different tsunami inundation depths: 0-1m, 1-2m, and 3m+.
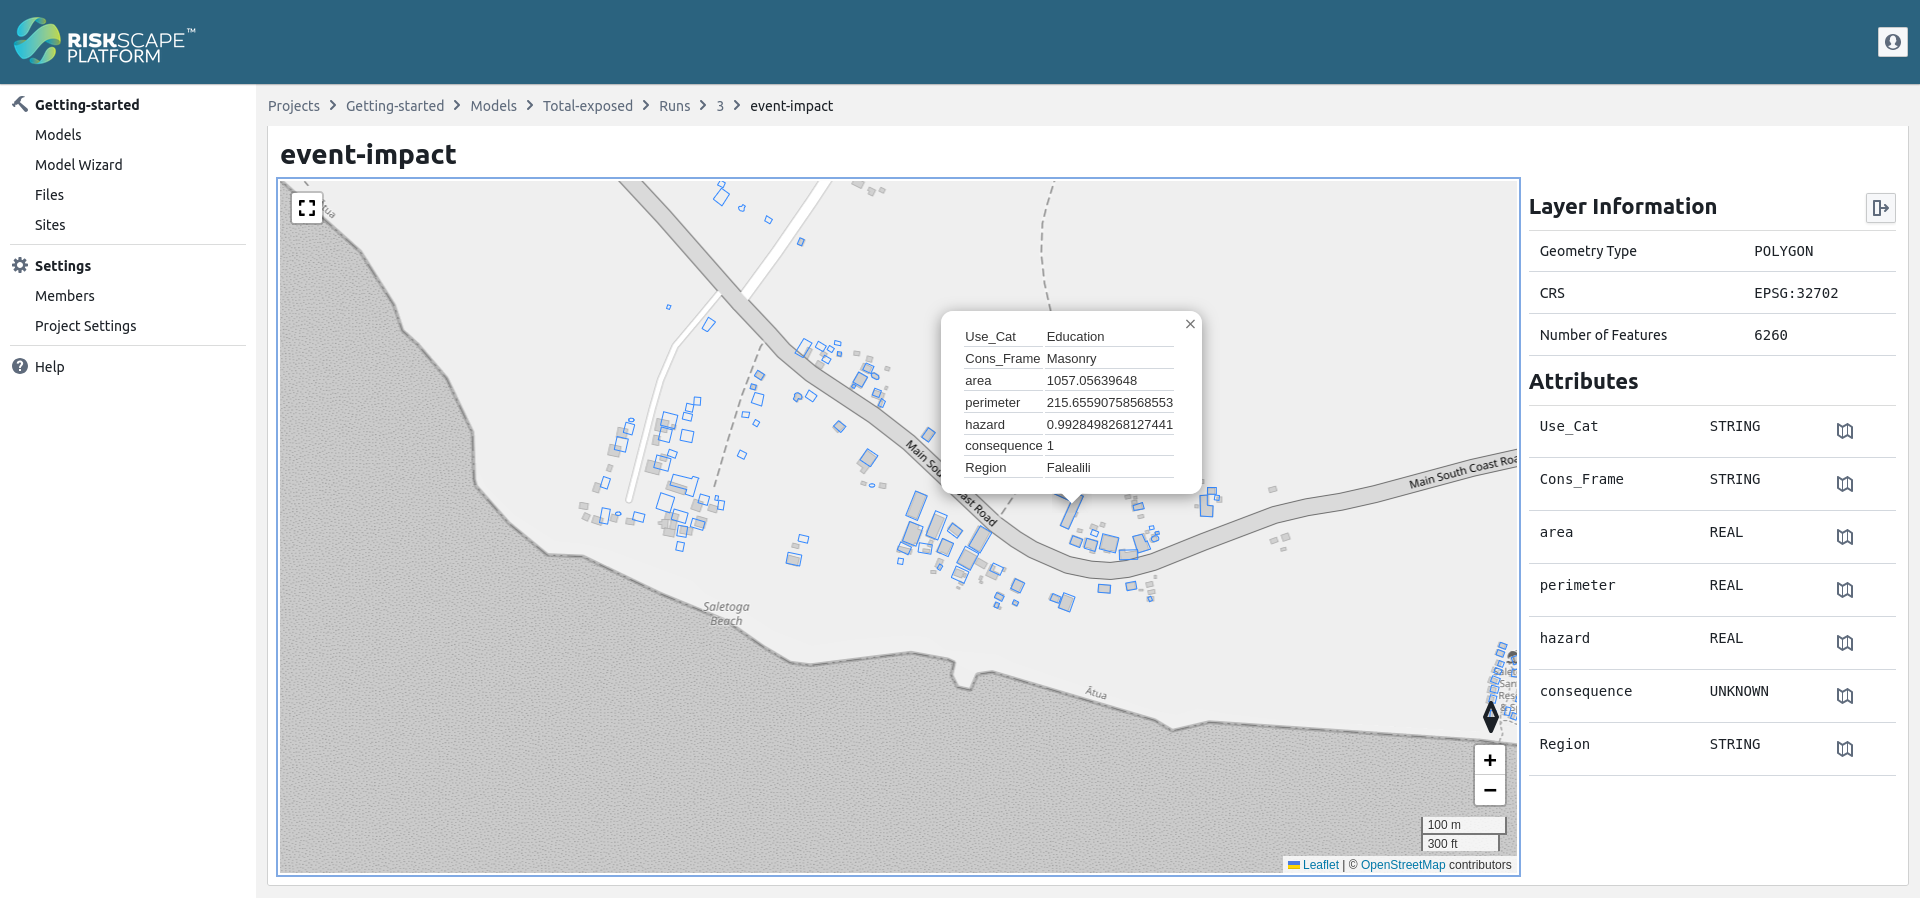
🌐 Click the eye icon to open the viewer for the ‘event-impact’ results file. This file contains the original
exposure-layer data, however, each building now has an additional hazard value (the inundation depth, in metres),
and a consequence value (1 or 0, based on whether the building was exposed). Try clicking on a building
to show the data for that building.
Re-running models with different inputs
The customizable aspects of a RiskScape model are called the model’s parameters. Changing the model parameters lets you change the behaviour of the model on the fly.
Model parameters let you customize the risk analysis to suit your needs. Re-running a model with different parameters will change the results you get. This is illustrated in the following diagram:
For example, you may have several different hazard-layers that simulate different events, or represent the uncertainty associated with an event in different ways. RiskScape lets you run multiple different hazard-layers through the same model.
So far, we have been using a GeoTIFF that models the tsunami inundation using a 10-metre grid resolution. However, we also have an alternative hazard-layer that models the tsunami using a 50-metre grid.
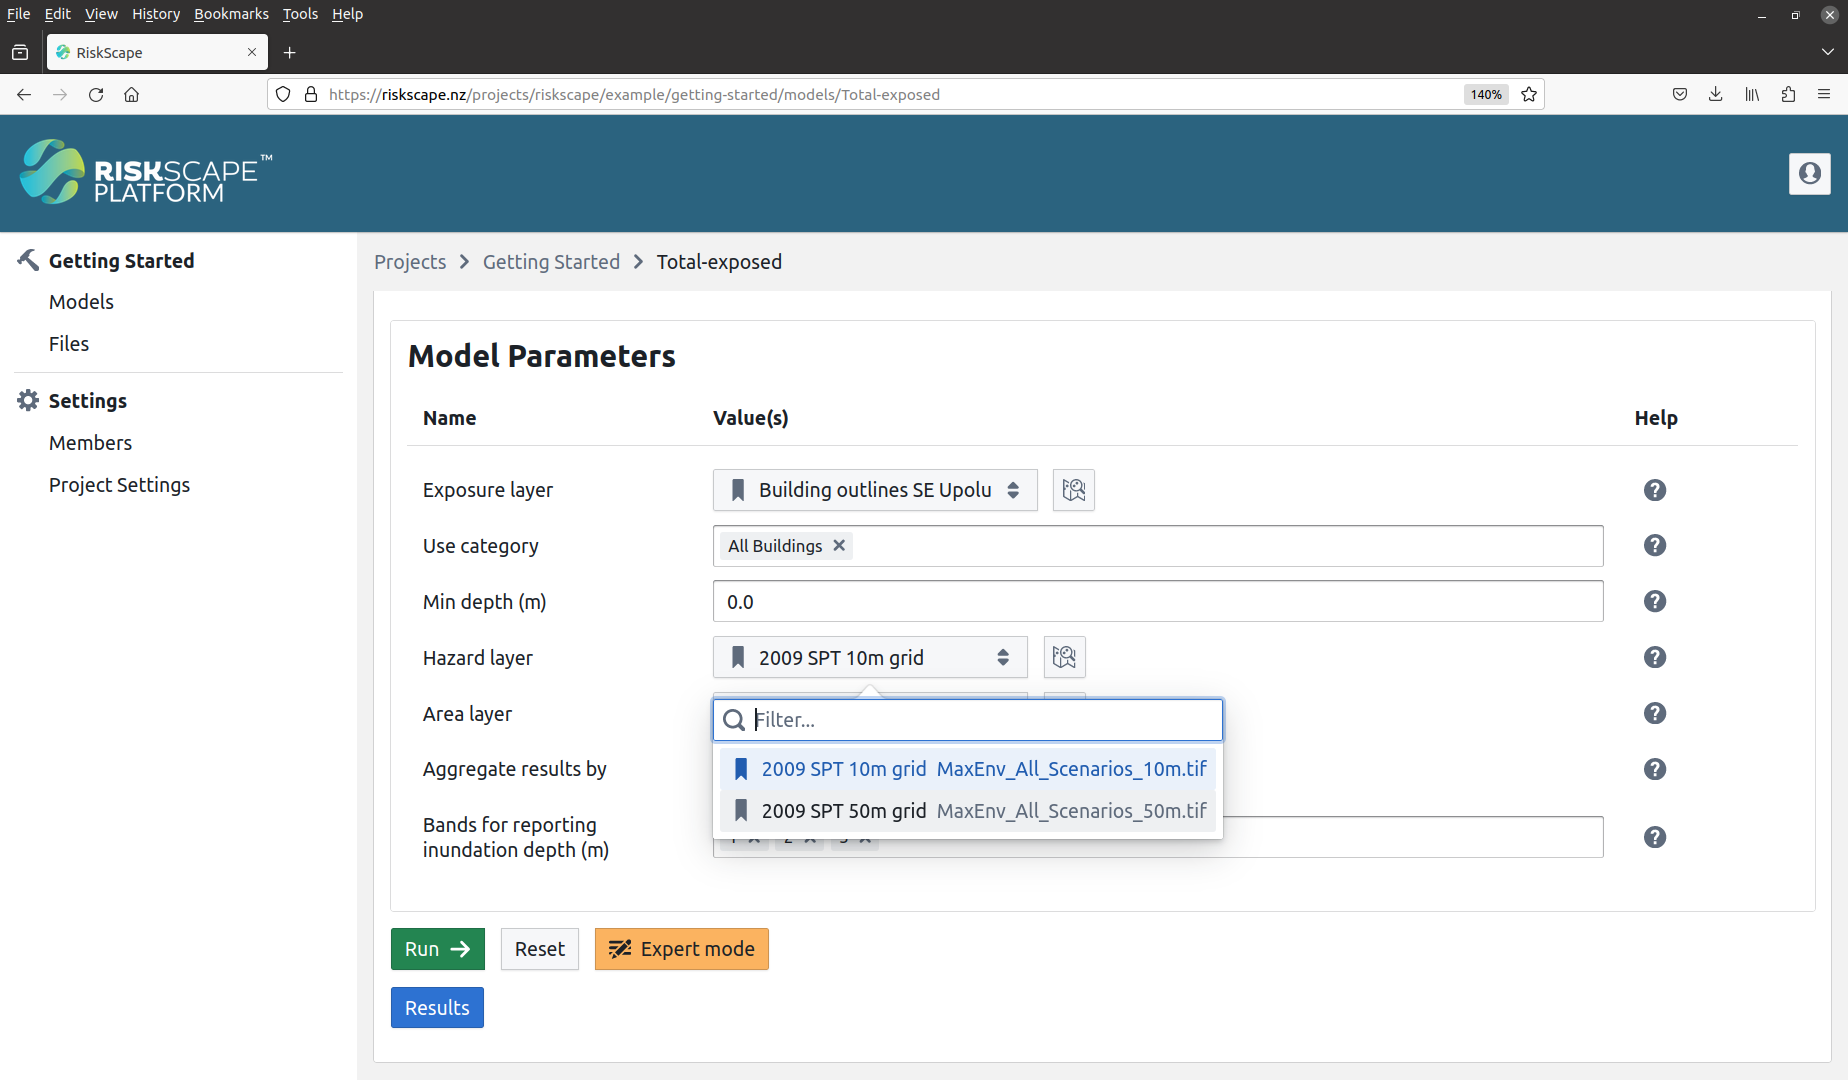
➡ In the Total-exposed model form, find the Hazard layer parameter and click on the 2009 SPT 10m grid button.
This will list the pre-defined hazard layers for the model.
Select the 2009 SPT 50m grid option, i.e.
➡ Click the ‘Run’ button to run the model again. The previous results will disappear and the progress bar will be displayed again.
This is now re-running the model analysis using a different geospatial hazard-layer (a 50m inundation grid instead of a 10m inundation grid).
➡ Once the model completes, click the view button for the ‘summary’ result. Compare the latest model results with the previous results you got.
You should see that the total number of buildings that were run through the model is the same (i.e. 6260 total), but now more buildings are reported as being exposed to the tsunami compared with the previous 10m grid (i.e. 2059 vs 1568 total).
Note
These hazard-layers originally come from a research paper that reached this same finding. The paper concluded that the coarser 50m hazard grid tends to overestimate exposure.
Changing the risk analysis
Changing a parameter in the model can let you change aspects of the risk analysis. This can help you answer questions, such as:
What were the affected buildings used for (residential, industrial, commercial, etc)?
What types of building (timber, masonry, concrete, etc) were exposed?
How many commercial or industrial buildings were exposed nationally?
How many residential buildings were exposed to 0.4m of inundation or greater?
So far we have been looking at the results regionally for the Total-exposed model. By varying the Aggregate results by parameter, you can view a breakdown of the results by ‘Use Category’ (residential, industrial, etc), or by ‘Construction type’ (timber, masonry, etc), or simply ‘Nationally’ to get a total result for all of Samoa.
➡ Try changing the Aggregate results by parameter to ‘Use Category’ and re-run the model. Open the ‘summary’ result file and see how it has changed. Then change the parameter to ‘Construction type’ and repeat.
Model parameters can have optional help text associated with them
that describes what the parameter does in more detail.
You can view the model parameter’s help text by clicking on the  icon on the far right.
➡ Click the  icon for the Aggregate results by parameter to read its help.
Try reading the help text for some of the other parameters in this model as well.
The Use category model parameter lets you filter the buildings based on use category. This means that only selected buildings (e.g. residential) will be included in the risk analysis.
➡ Try updating the Use category parameter - remove ‘All buildings’ and select ‘Commercial’ and ‘Industrial’ instead. Change the Aggregate results by parameter to ‘Nationally’ and re-run the model. Open the ‘summary’ result file and see how it has changed.
Note
The Total_count of buildings has now changed, as only the selected building types were included in the results.
Instead of 6260 total buildings, there are now only 62 total buildings reported.
🌐 Try opening the ‘event-impact’ results file. See what difference this parameter change has made to the building outlines that are included in the results.
Finally, the Min depth (m) parameter lets you customize at what inundation depth a building becomes exposed. So for example, if residential buildings had a minimum floor height of 0.4m, then you might only want to know about buildings exposed to more than 0.4m of inundation.
➡ Update the Use category parameter again, so that only ‘Residential’ buildings are selected. Update the Min depth (m) parameter to be 0.4 and re-run the model. Open the ‘summary’ result file and see how it has changed.
Tip
The model run form includes a ‘Reset’ button that lets you reset all the model parameters back to their default values. This can be helpful if you want to undo any changes to model parameters that you have made.
Saving and sharing model results
Each model has a ‘results’ page that shows you all the previous times you have run the model.
➡ Navigate to the results page for the Total-exposed model. To do this, go back up a level to the Getting started project view, then click the ‘Results’ button for the Total-exposed model. Alternatively, you can click this link to go directly there.
The results page shows you all the previous times you have run the model. It should look something like this:
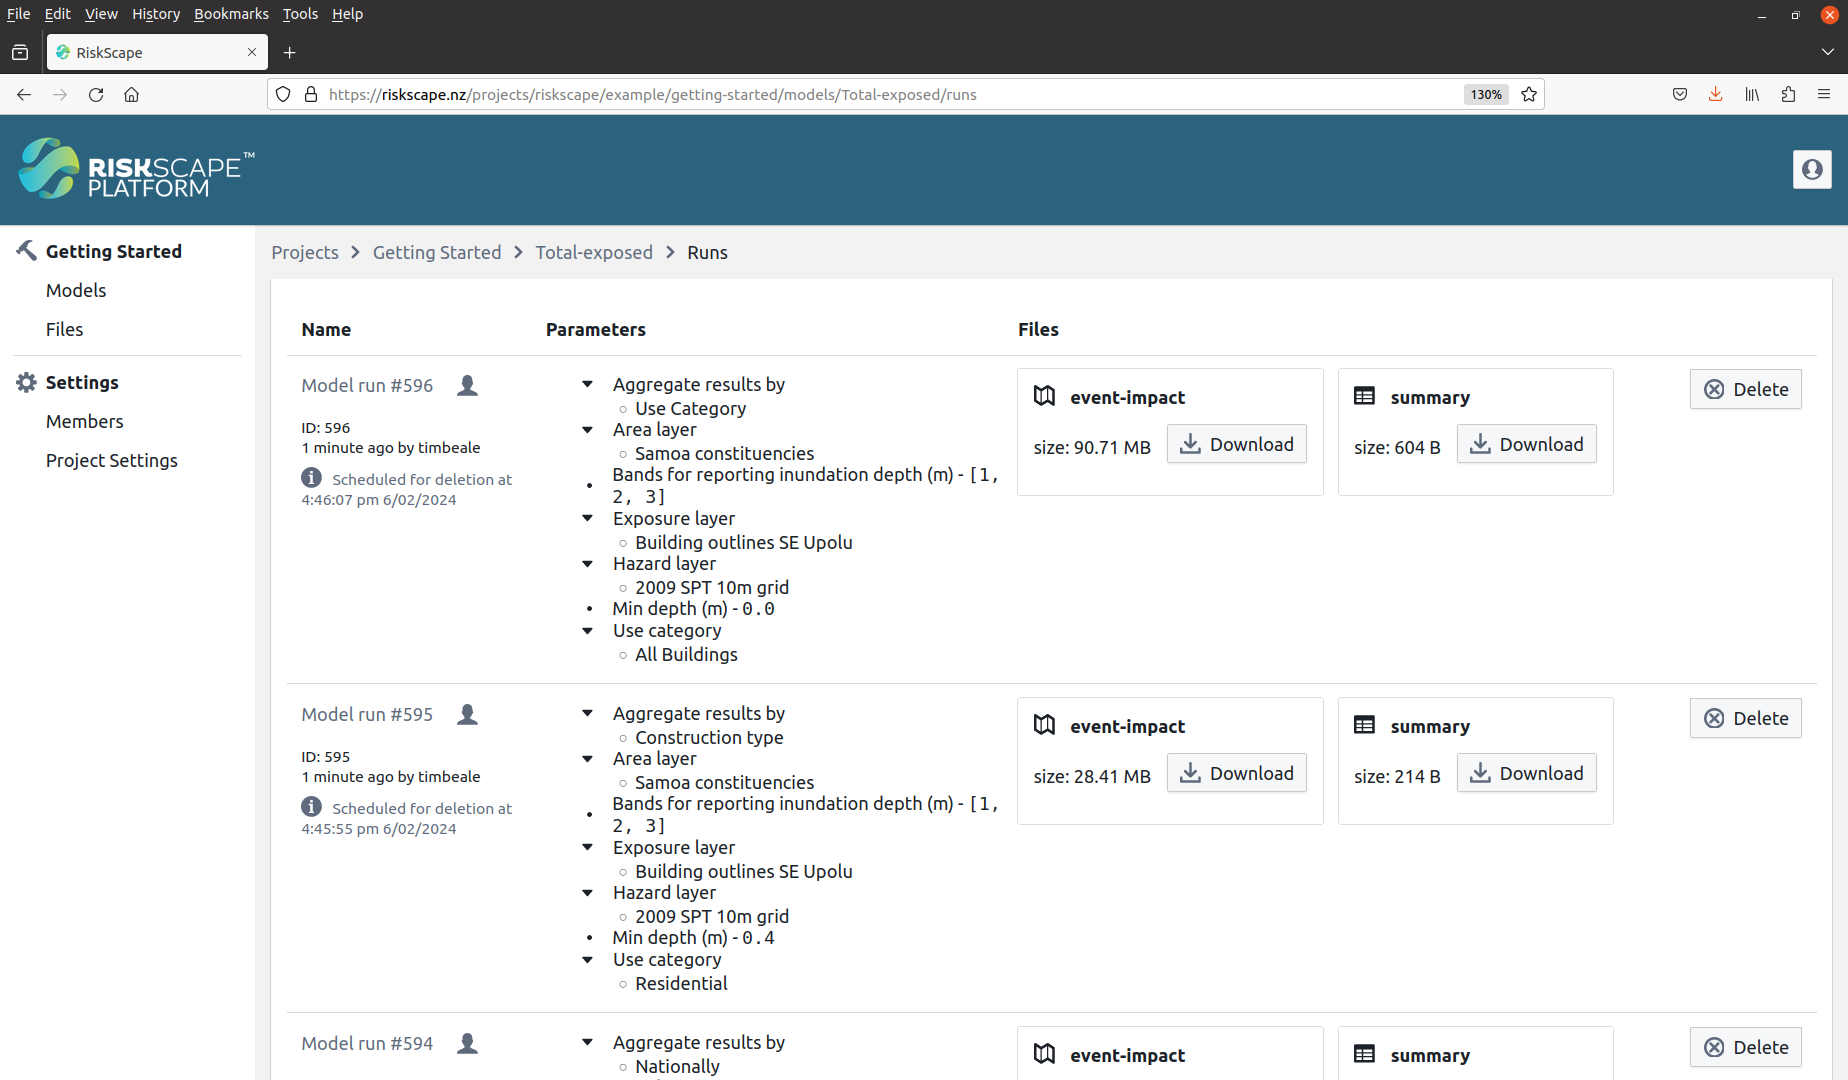
The results page includes the various result files, and lists the model parameters that were used to produce each result.
Note
By default, model results will be deleted after a specified period, e.g. after seven days. You can also use the ‘Delete’ button to immediately delete any results you no longer want.
To prevent the model results from being automatically deleted, you simply give the model run a name in order to save the results.
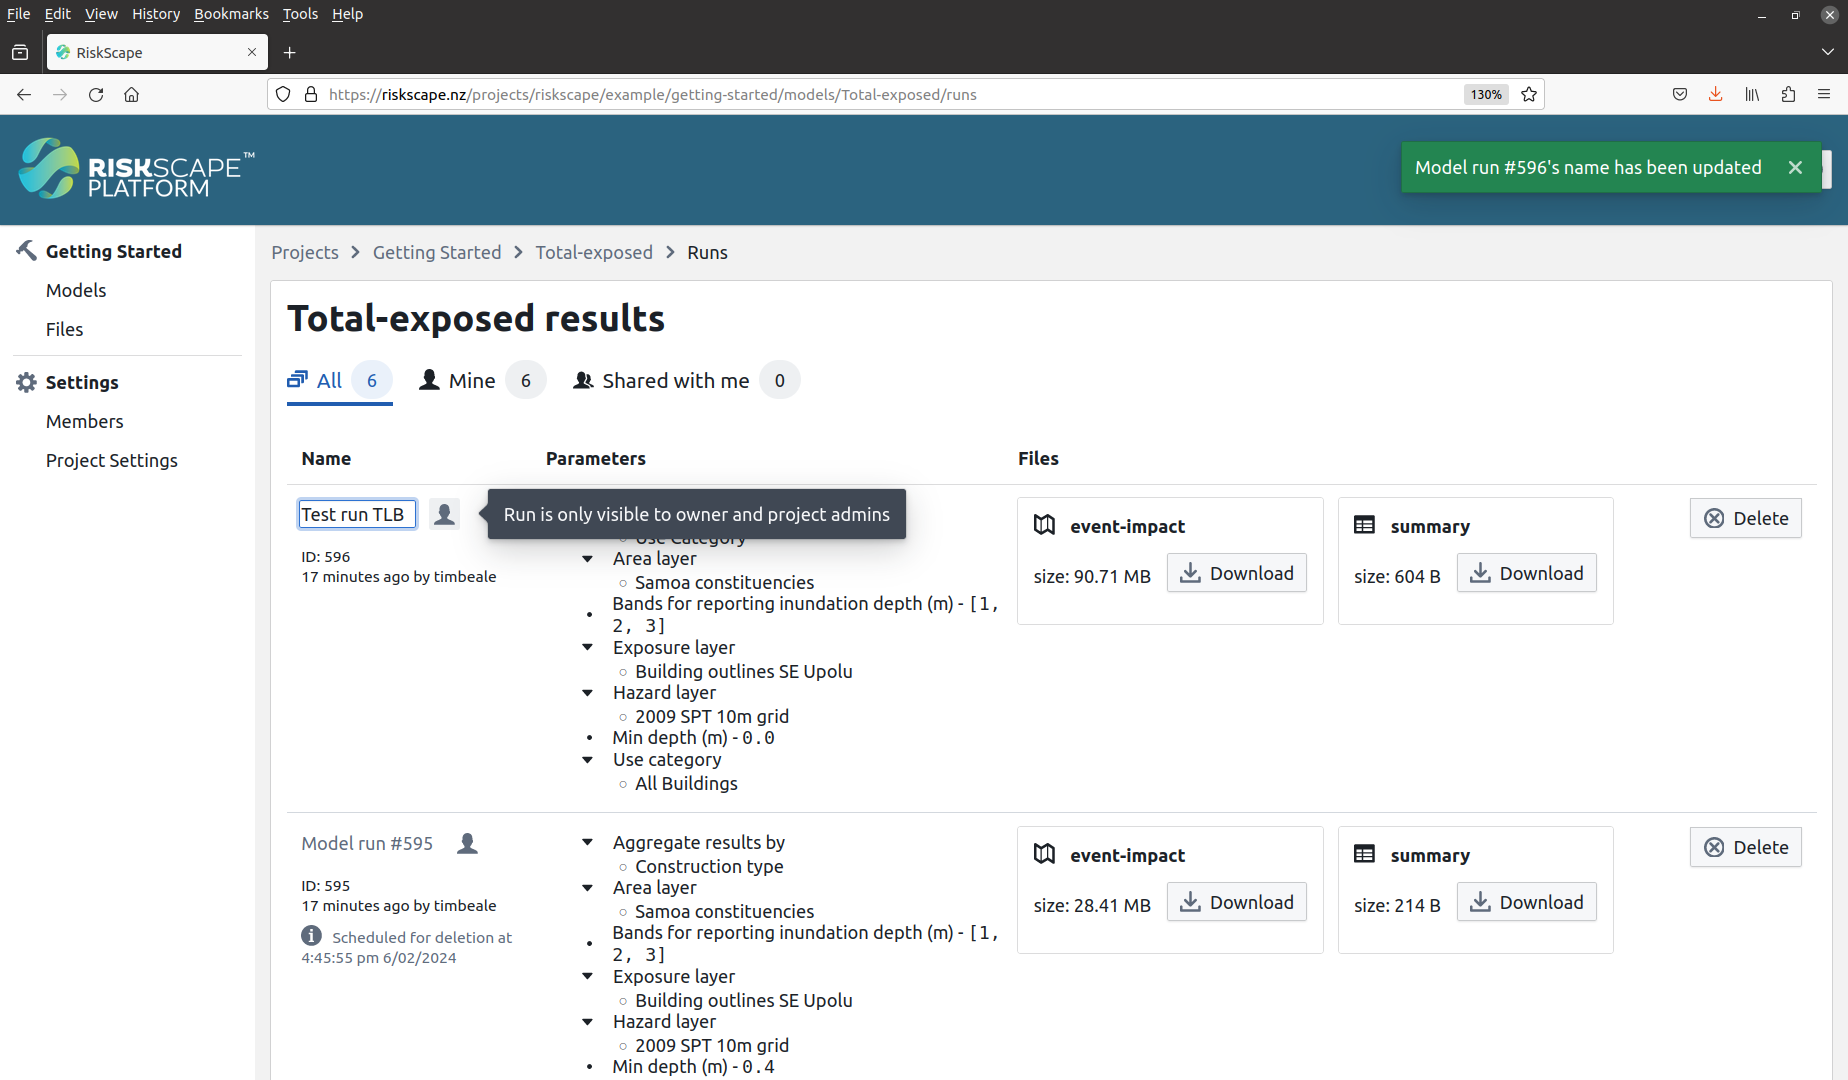
➡ Pick a model run to save and click on the Model run #xyz text on the left-hand side.
Start typing a name for the model run.
It should look something like this:
Tip
You must choose a unique name for the model run.
Typically, the name should be meaningful and relate to the analysis you carried out.
For now, you might just want to call it Test run, and include your initials to make the name more unique.
At the top of the model results page there are toggles to view ‘All’ results that you have access to, as well as just the results you have generated yourself (‘Mine’), and the results that other users have shared (‘Shared with me’).
➡ Click on the ‘Shared with me’ toggle. You should be able to see the ‘Shared example’ model results, along with any other results that previous users have shared. Then click on the ‘Mine’ toggle so that you only see your own results.
Once you have named your model results you can then share them with other users on the RiskScape Platform.
Just to the right of each model run’s name, there is a  icon that you can click on to
share your results with other users in the project.
Tip
Running a model requires a RiskScape Engine resource, which incurs cloud computing costs. Sharing a model run means that other users can view the same set of results without incurring any extra cloud costs.
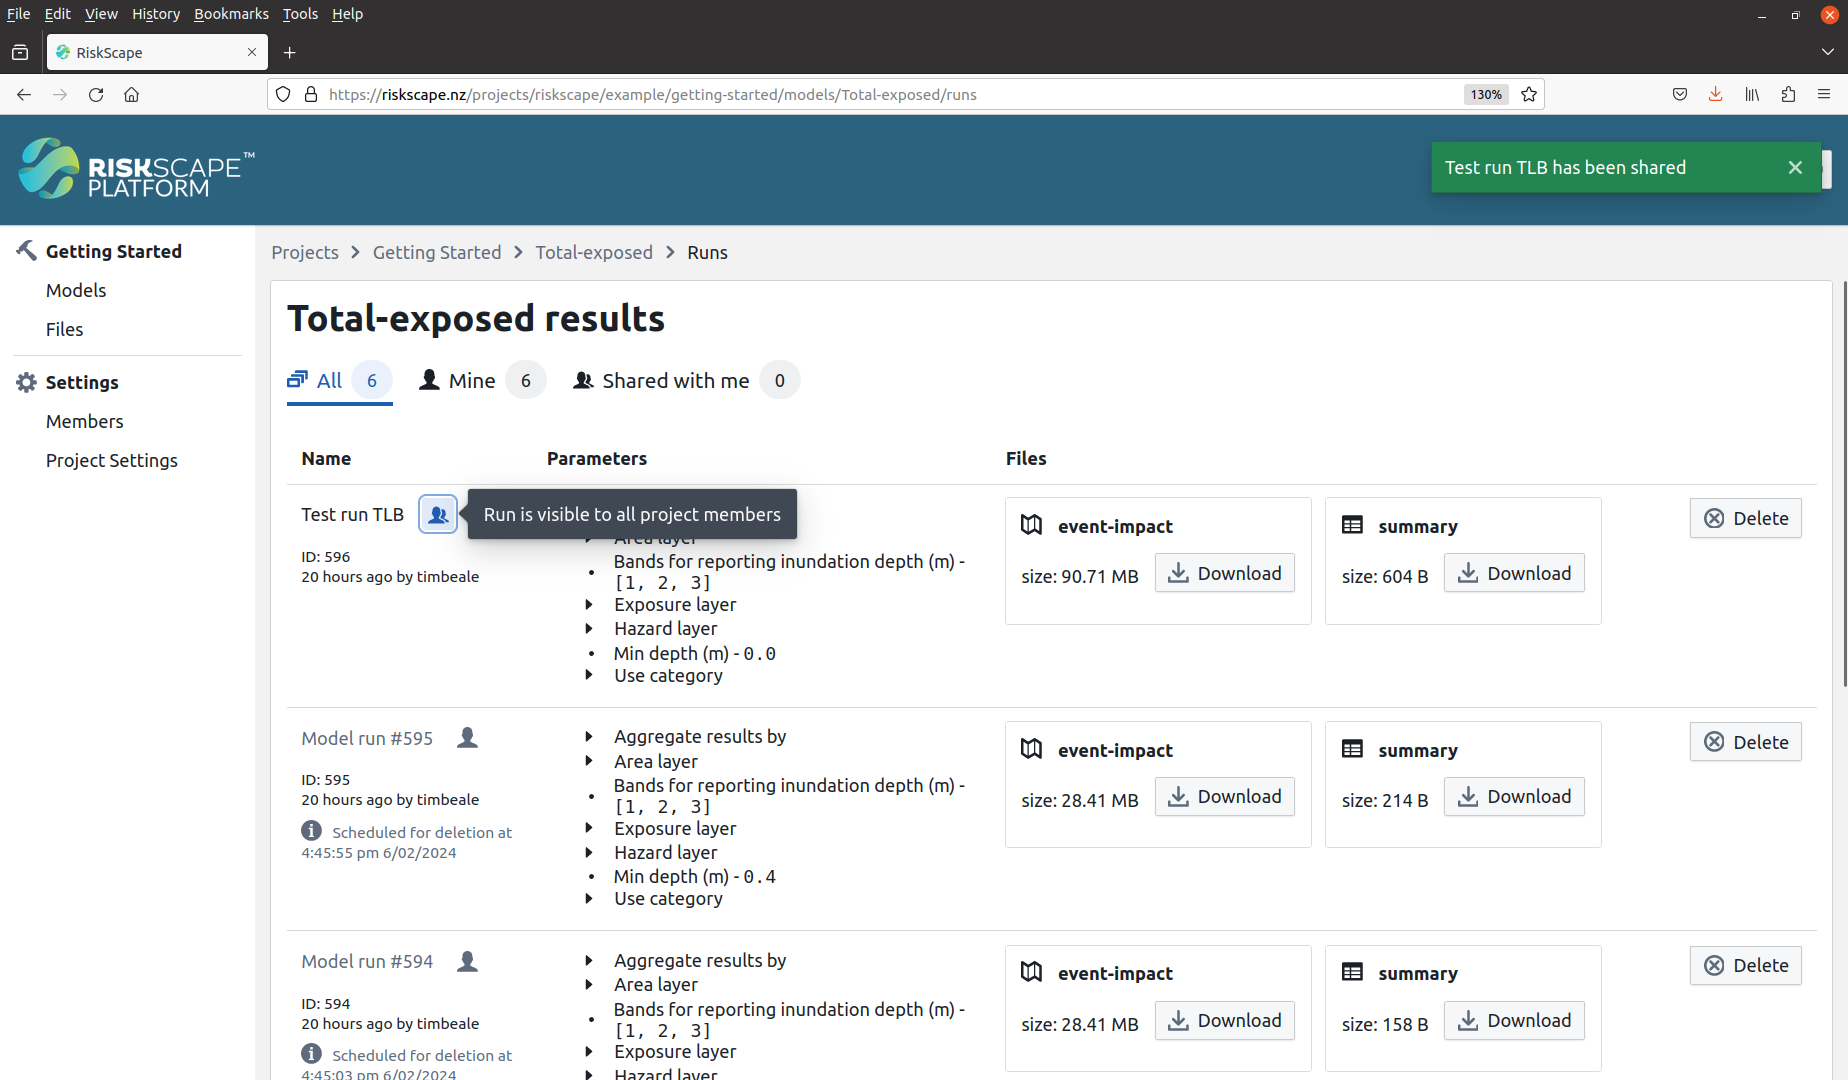
➡ Click on the  icon next to the model that you have just named to share your results.
It should look something like this:
Note
Other RiskScape Platform users must be members of the same project in order to see the shared results. So the visibility of sharing results is generally limited to people you are already collaborating with on a project.
Using your own input data
➡ Navigate back to the Total-exposed model run form. Alternatively, you can click this link to go directly there.
So far we have been using pre-defined geospatial layers when we run the model. However, RiskScape models are flexible and typically let you specify your own input data, providing it contains the attributes and values that the model expects.
Some model parameters will let you choose which geospatial layer to use from one of the following sources:
Project storage: This is the shared file system for the project. Project storage will be visible to all other members of the project.
Personal storage: Files in personal storage will not be visible to other members of the project, and so can only be used in models that you run yourself.
Your device: You can browse the files on your local computer to find the input layer that you want. You can then choose whether to upload it to project storage or personal storage.
Whether you can upload files to project storage depends on your user role within the project. Whilst any project member can use the files in project storage, only the project admin can upload files to project storage.
Tip
The Navigating project files tutorial will explain how file storage works in the RiskScape Platform in more detail.
➡ Click the  next to the Exposure layer model parameter.
This will bring up a file chooser dialog box.
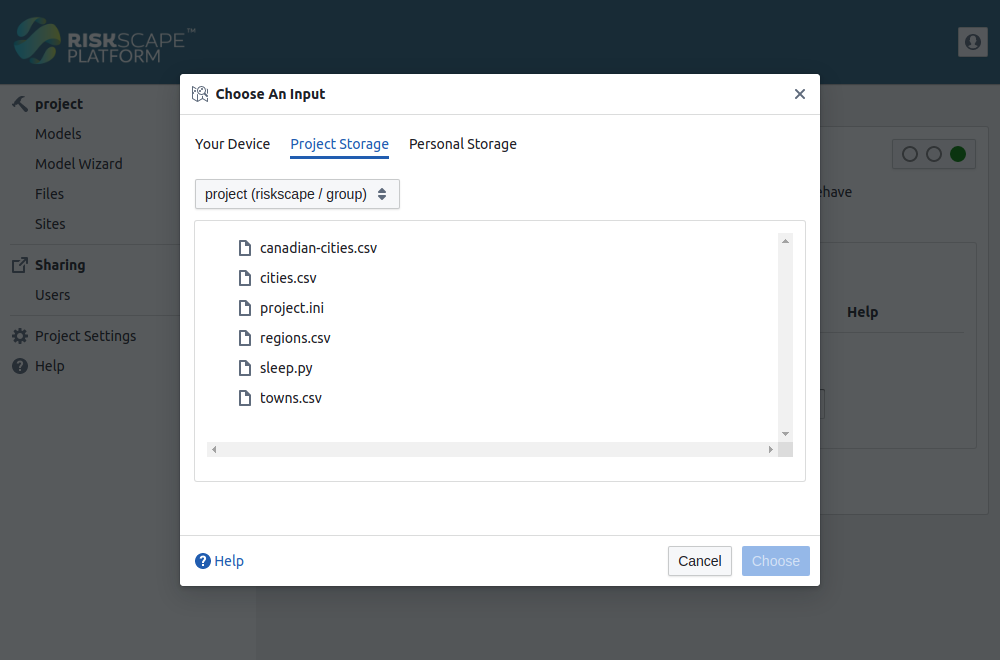
Select ‘Project storage’, look for the
 Roads_SE_Upolu.gpkg file, and click on it.
This should look something like:
Vector input data will sometimes have required attributes that the model relies on.
For example, building damage may be calculated based on the building construction-framing type,
and therefore a Cons_Frame attribute representing that information may be required by the model.
In this case, the model requires that the exposure-layer has Cons_Frame, Use_Cat, and the_geom attributes.
These attributes may have a slightly different name in the input data you are trying to use,
and so the RiskScape Platform lets you pick the correct attributes to use in the model.
➡ Select the Material attribute to use for Cons_Frame, and select the Road_type attribute to use for Use_Cat.
It should look something like this:
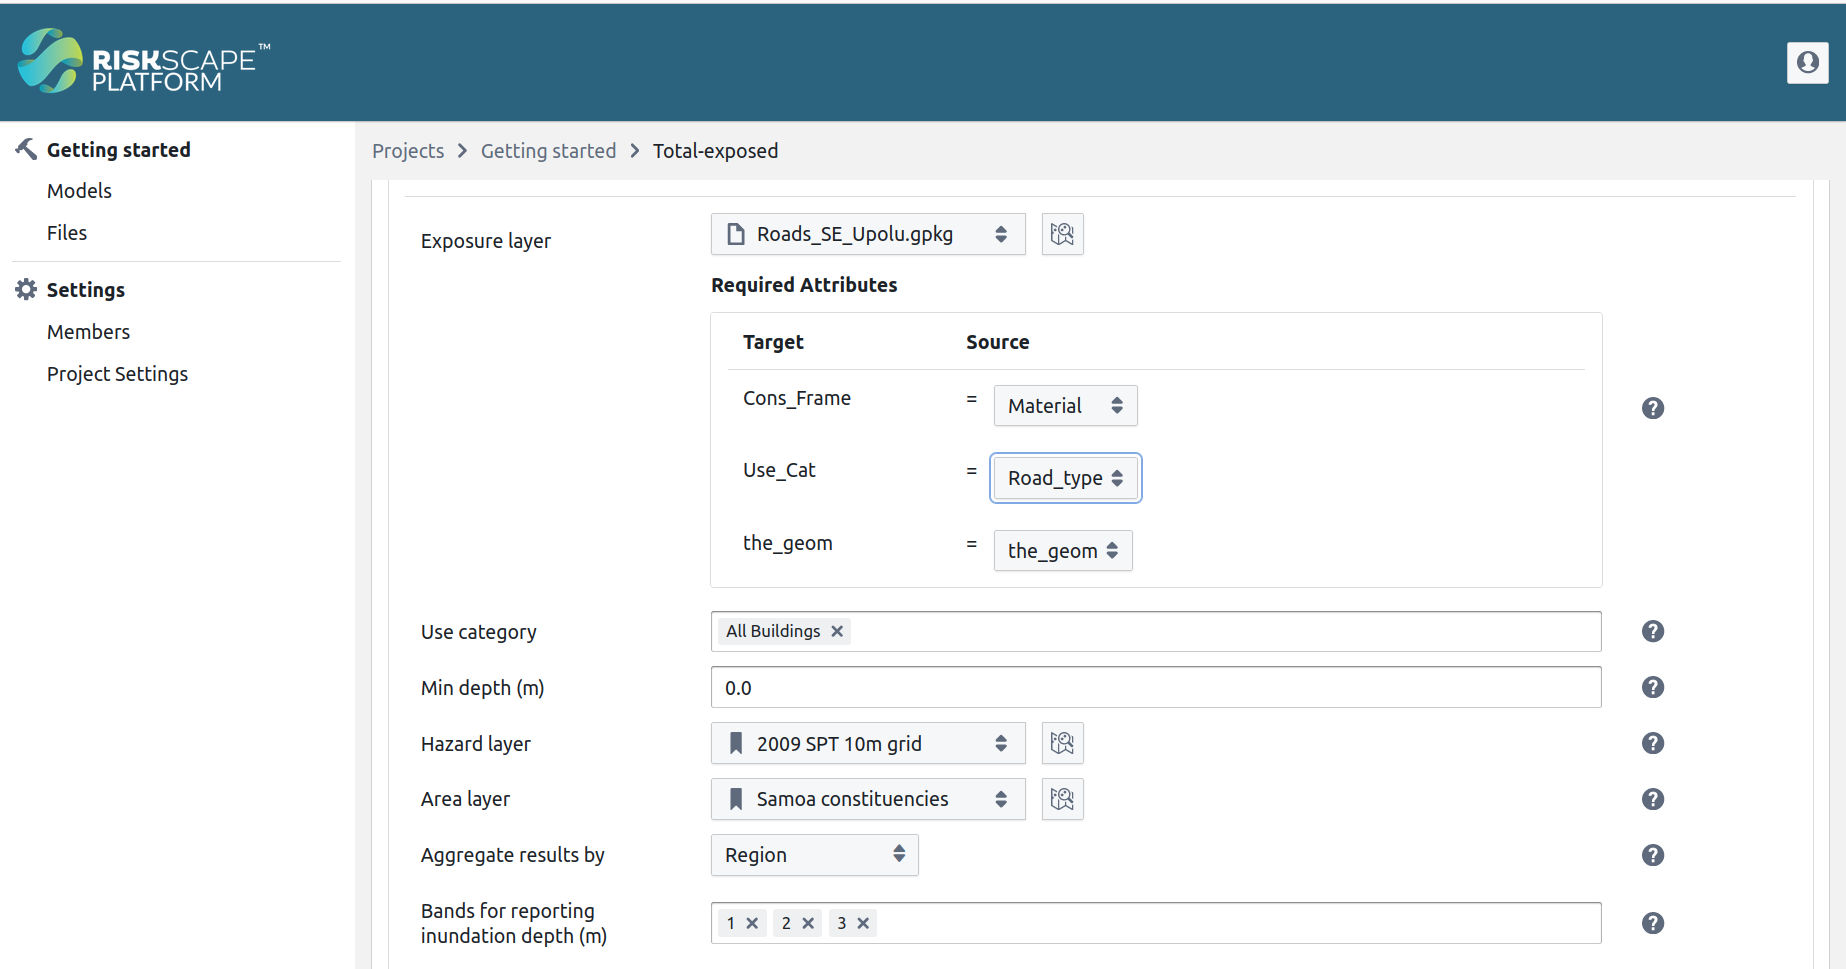
➡ Click the ‘Run’ button, and once the model completes, open the ‘summary’ results file. This should now show you the number of exposed roads in each region.
Note
The geospatial sampling in the Total-exposed model is intended for small geospatial features, like buildings.
For larger features like roads, the model will still accurately report the total number exposed.
However, the Depth values may not reflect the maximum inundation depth for the road.
🌐 Try opening the ‘event-impact’ results file. Instead of building outlines, this now includes the road line-string data. Click around to see what roads were exposed.
Tip
Shapefile data is currently not supported with the RiskScape Platform. When uploading your own data, please use GeoPackage or GeoJSON format.
Damage functions
So far, we have simply been determining whether a building (or road) was exposed to the tsunami inundation or not. RiskScape lets modellers define their own Python functions that can analyse the impact of the hazard. This means that modellers can customize a RiskScape model to basically do whatever risk analysis they want it to.
We will now look at a model that uses the Samoa_Building_Fragility Python code to calculate the probability of being in a given damage state for each building.
The RiskScape function uses a log-normal Cumulative Distribution Function (CDF)
to determine the conditional probability (between 0 and 1.0) of a building being in a given damage state as a result of the tsunami inundation.
The following five different damage states are used, DS_1 through to DS_5:
Light: non-structural damage
Minor: significant non-structural and minor structural damage
Moderate: significant structural and non-structural damage
Severe: irreparable structural damage requiring demolition
Collapse: complete structural collapse
The building’s fragility (i.e. the shape of the log-normal CDF curve) will be different depending on the building’s construction material. For more background on how the fragility curve was determined, refer to the research paper Evaluating building exposure and economic loss changes after the 2009 South Pacific Tsunami.
The Building-damage model then uses the Building_Damage_State function to assign an overall damage state to each building, based on the calculated probabilities, using a weighted random choice.
Note
This weighted random choice is factoring uncertainty into the model. It is essentially ‘rolling the dice’ to determine the severity of damage to any given building.
➡ Navigate to the Building-damage model run form in the RiskScape Platform. Alternatively, you can click this link to go directly there. Click the ‘Run’ button, and once the model completes, open the ‘summary’ result file.
Instead of simply reporting the inundation Depth, the summary results file now includes
a regional breakdown of the predicted Damage to buildings.
🌐 Try opening the ‘event-impact’ results file.
Clicking on a building outline will show you its overall damage state (based on the weighted random choice),
as well as the probability of being in each damage state (DS_1 through to DS_5).
You can also see the overall damage states visually by using the viewer’s choropleth feature. In the attributes tab on
the right hand side, click the map icon next to DamageState. Each building will be coloured by its overall damage
state. You can change the colours used by clicking the gear icon in the legend.

Note
We have seeded the random number generation here so that the randomness is reproducible, i.e. the model results are consistent between model runs. This means that a given building will make the same random choice every time the model is run, but that random choice may still be different to other similar buildings.
Customized model outputs
You may have noticed that the Building-damage model produces several other results files besides the ones we have looked at so far. RiskScape models can be integrated with Python post-processing to turn simple model results into more complex outputs, such as graphs, or even PDF documents. The Building-damage model also produces the following results files:
building-damage-states.png: A bar graph of the total buildings in each damage state.regional-collapsed-buildings.png: A choropleth map based on the number of collapsed buildings in each region.Report-Summary.pdf: A simple PDF report that was auto-generated from the values in the model results.
➡ Have a look at each file by clicking the eye icon next to each one.
Integrating customized outputs into the RiskScape model like this means that they get updated whenever the underlying values in the model results change.
➡ Try changing the hazard layer from the 10m grid to the 50m grid and run the model again.
Have a look at the Report-Summary.pdf and see how the numbers and graph in it have now changed to
reflect the latest results.
Tip
Advanced users can learn more about using Python to customize model outputs in the RiskScape Engine documentation.
Exploring other Platform features
So far we have only been looking at the models in the project and their results. On the left-hand menu panel will will also see:
Model Wizard: This feature lets you interactively build new risk models, based on the functions and input data available in your project.
Files: These are all the files that go into the model. This includes input data as well as data-processing instructions for the RiskScape Engine. Any member of the project can view the files, but only the project admin can update the files. To learn more about the project files, try going through the Navigating project files tutorial.
Sites: This links to any Microsites for the project. Microsites are optional, custom-built websites that let you tailor how users interact with the RiskScape Platform and the model results. By default, most projects won’t have any Microsites associated with them.
Settings: This lets the project admin add and remove other users from the project. It also lets the admin change underlying settings for the project, like what CPU resources the RiskScape Engine should get. You are only a member of this project, so you cannot change any of the project settings.
If you want to learn more about how RiskScape models work, you could now try going through the Building your own RiskScape model tutorial.